Embodied Conversational Agents in Collaborative face to face Computer Supported Learning Games

niñosStudies show that face to face collaborative videogames have a great potential to improve the quality of education in the classroom of the future. Educational games can help pupils increase cognitive skills, increase motivation and reduce the time taken to reach learning objectives. Games used in a group environment can enrich the learning experience further still by helping develop group social skills and exploiting social dynamics toward achieving a common learning objective. Despite these advantages the uptake of collaborative games as learning tools in the classroom is still relatively low. While collaborative working has proven advantages they also suffer from an incompatibility with the ingrained individualism of traditional education. Moreover, collaborative working can disadvantage introverted students, suffer from conflicts within a group or allow less motivated students to avoid making a contribution. This work investigates the viability of these disadvantages being managed through the intervention and mediation of an intelligent embodied conversational agent with awareness of group activity acting as a virtual tutor.

Methodology

In order to investigate the role of Embodied Conversational Agents (ECAs) in collaborative learning games we undertook an experiment that allowed us to observe children using a variety of collaborative games with and without the assistance of an ECA. Before and after the experiments the children were given written tests to assess specific learning objectives and during the tests we recorded audio and video. We also asked the students to complete questionnaires to determine how they felt about the level and quality of collaboration.

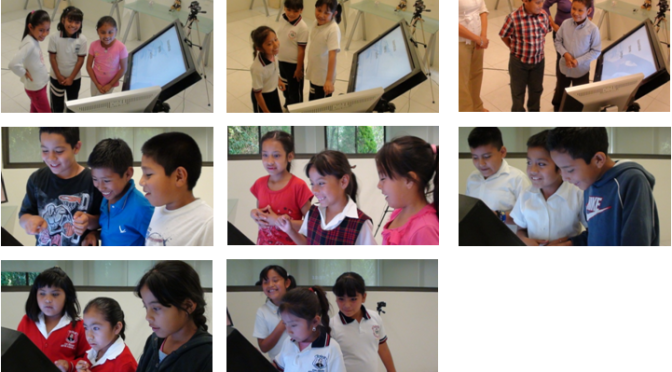
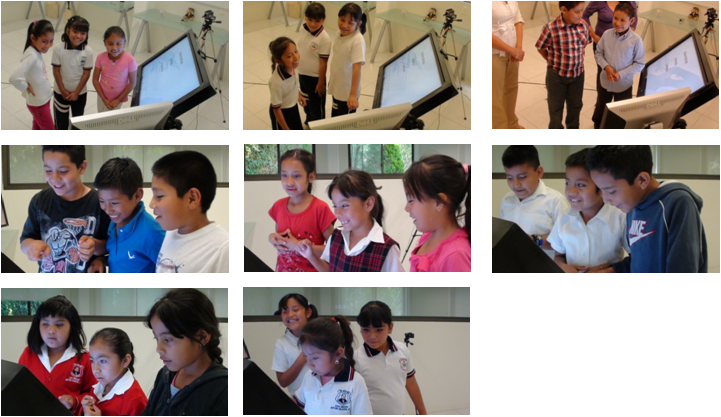
Our experiments involved six groups of three children aged eight to ten years. Each group spent two hours playing educational videogames. Half of the groups were joined by Samuela, the ECA virtual teaching assistant, and half were unsupervised. Four groups were all female (two with and two without Samuela) and two groups all male (one with and one without). Each child was tested immediately before, immediately after and four days after their session with Samuela. The exams used for this testing included three five minute sessions testing mathematics, languages and reading. Three versions of each exam were created so that no two students in the same group would do the same exam at the same time and no one student would do the same exam twice. This helped ensure that any differences in difficulty between the questions would average out over the course of the experiment.

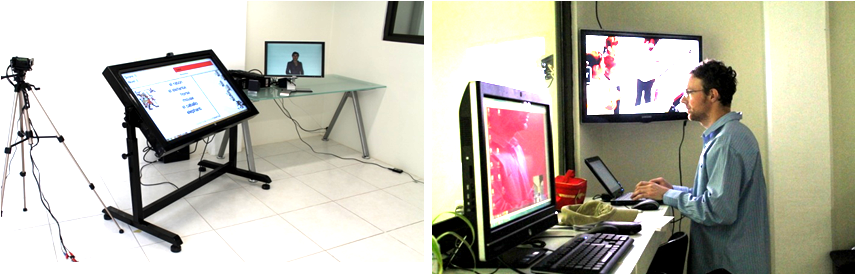
The set-up of the experiment is shown below. Games were played on a forty-two inch screen angled at forty-five degrees and raised between waist and head height. The children were observed through two-way glass with audio and video recorded throughout. When our ECA, Samuela, was involved in experiments, she was controlled using a wizard-of -oz set-up visible to the students on a separate 26 inch monitor. The students were not made aware that Samuela was operated by a human controller.

woz
WoZ Experiment set-up

Educational Videogames

Three educational games were developed for our experiment. In order for the games to be both accessible and challenging for children with different levels of learning, we tried to incorporate a gradually increasing level of difficulty. Other key aspects of game design were cultural relevance and age appropriateness. Here we tried to ensure that the games were non-violent and did not enforce gender stereotypes while encouraging the children to identify with elements of their native Mixtec and Mexican culture.

matimaticas
Mathematics Game

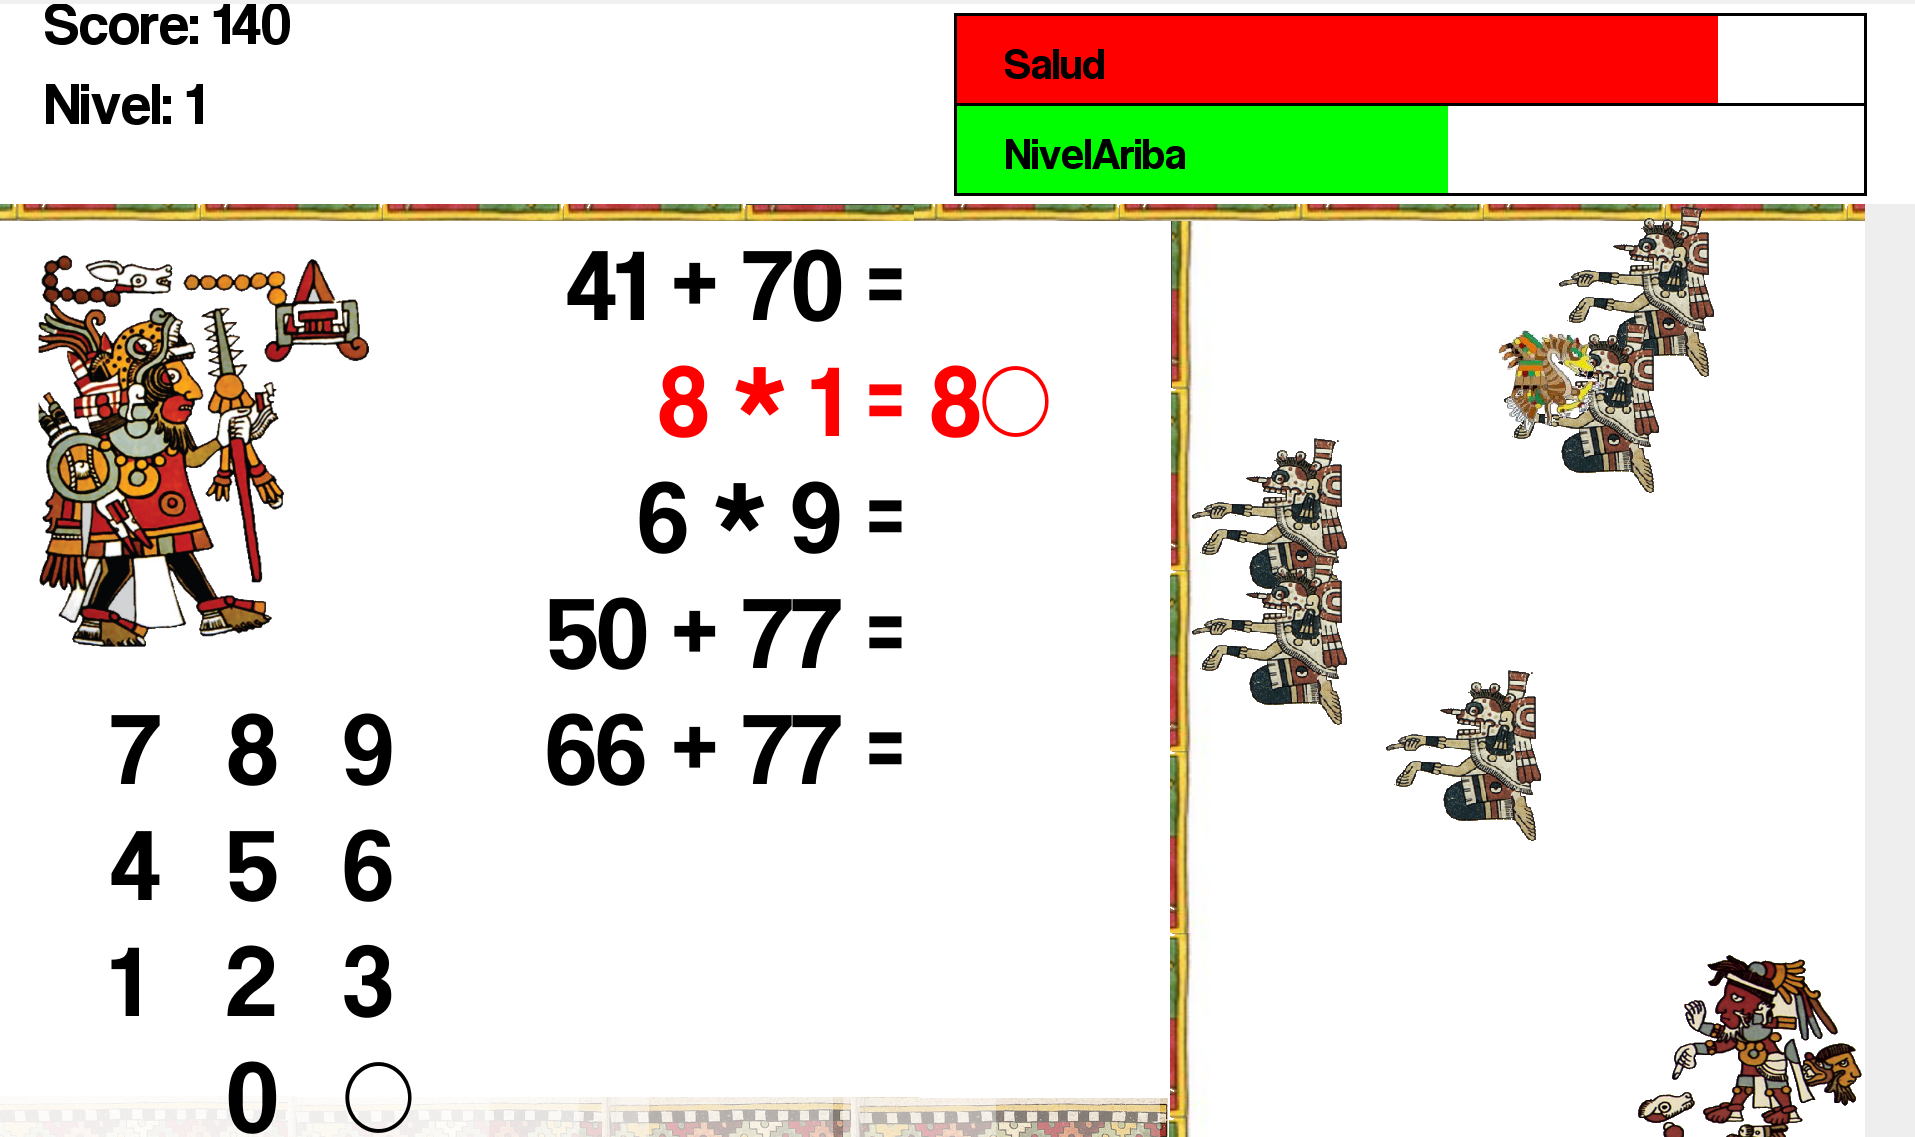
The mathematics game is a simple ‘castle defense’ type game where the students have to solve mathematical equations to fire eagles and prevent the muertes from reaching the perimeter wall of their town and draining their energy. The character of the user, the jaguar, sits at the left hand side of the screen. Below this character is a keypad and to the right a list of sums. To the right of the sums is a vertical wall and beyond the wall are the muertes. Each muerte advances slowly from right to left toward a sum and if a muerte reaches the wall it stops and begins to drain the health of the user. When the health of the user reaches zero the game is over.  In order to stop muertes reaching the wall the user can answer sums to fire eagles. The user can press on different sums to answer them using the keypad. If a sum is answered incorrectly health is drained and if a sum is answered correctly an eagle is fired from the wall toward the right hand side of the screen. When a muerte is hit by an eagle it is pushed back away from the wall. Pushing back muertes also adds to the users score and causes the level-up bar to rise. When the level up bar is full, every sum fires an eagle to push all the muertes back and the user progresses to the next level. As the level increases, the muertes begin to speed up and it becomes gradually more difficult to do all the sums on time and keep the muertes away from the wall.

idiomas
Languages Game

The second game encourages students to learn the names of animals in English. This game is a similar ‘castle defense’ type game to that used to learn mathematics described above. However, instead of doing sums to fire eagles the students have to match words in English to their Spanish translations. When words are matched correctly eagles are fired from both words and health is drained when words are matched incorrectly. The game begins with a small number of words for more common animals such as cats and dogs. As the game advances the difficulty level increases with a wider variety of gradually more obscure animal names. If the children are not already familiar with the names of these animals in English, they can normally find the translations out by trial and error and learn from their mistakes.

lectura
Reading Game

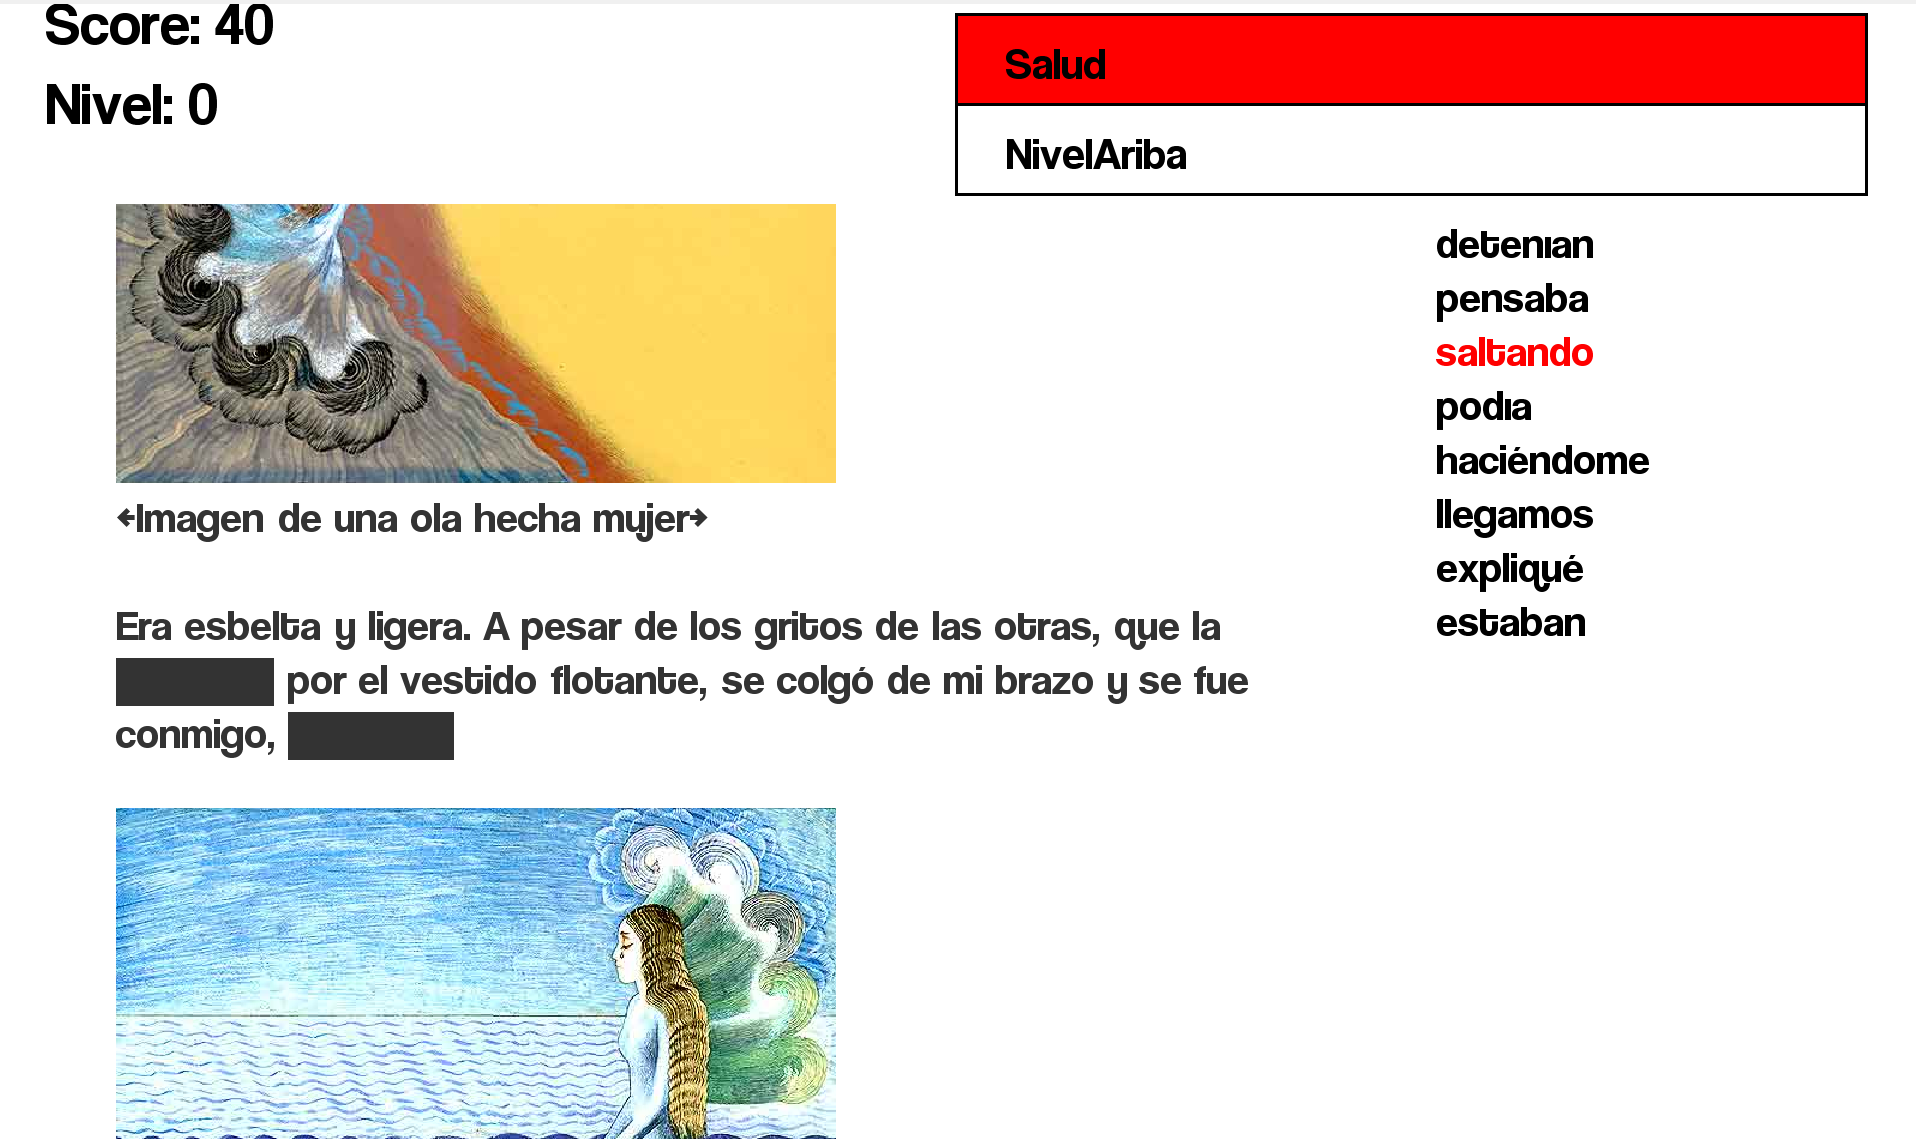
The third game aims to help the children with reading by asking them to complete a story by replacing missing verbs. Literature and authors are held in particular esteem in Mexico, and Latin America in general, with popular authors often becoming diplomats or politicians. This game encourages the children to explore the Mexican side of their identity by using an adaptation of the short story ‘Mi vida con la ola’ by Mexican Nobel laureate for literature Octavio Paz. During the game, text from the story with missing words moves toward the top of the screen. The user can replace missing words from a list of words at the right hand side of the screen. If a word is replaces successfully the score increases. If however the children attempt to enter the wrong verb into a space, health is drained. Likewise if the space for a missing word reaches the top of the screen without being filled, health is drained and the text stops scrolling until a correct word is entered. While the text is scrolling the health replenishes slowly and as the children progress through the text by replacing words, the missing words become more frequent so as to make the game more difficult.

Samuela the Embodied Conversational Agent

To emulate an ECA in our experiment we used a Wizard of Oz set-up. This involved an avatar controlled by an unseen human operator giving the impression of an autonomous system. This allowed us to emulate an ECA running under ideal conditions without any of the undesirable artifacts, such as slow or inappropriate responses, that might be evident if we decided to use an actual autonomous ECA. This also allowed us to avoid having to rely on non-mature technologies such as imperfect speech and emotional recognition that would be likely to become a cause of unnecessary confusion during the experiments.

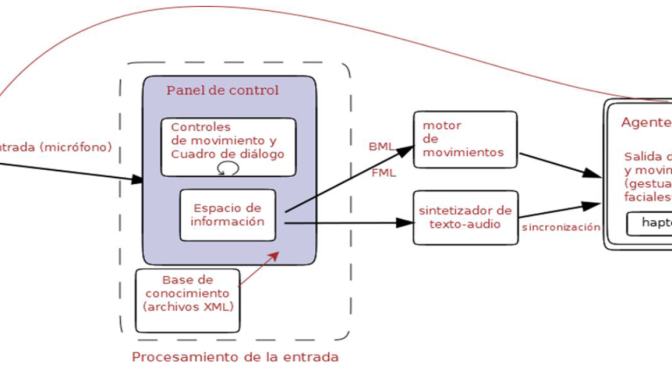
The avatar used in our experiment, Samuela, was originally developed by Telefónica R&D using Hapteck Software for the European Union funded project Companions. The original version of Samuela used in the project spoke English and was northern European in appearance with blonde hair and blue eyes. To make Samuela more familiar and understandable for the students involved in our study based in the Mixteca region of Mexico we changed Samuela’s language to Latin-American Spanish and her hair color to dark brown (see figure 4). In order to make Samuela speak we developed a basic interface that allowed the operator to type words and have them sent to Samuela by pressing the return key. This ran on the same laptop computer as Samuela using a different monitor. The monitor to view Samuela was placed in the games room with the children and the laptop computer with the control interface was left in the observation room.

samuela
Samuela

Results

The children’s performance did not improve much immediately after their session with the games. This was most likely due to the children being tired and over-stimulated after playing the games for two hours. When the students were tested again, four days after the tests, there was a significant improvement in their performance. This improvement was particularly marked for mathematics where the student’s performance showed an increase of 21.9%. The improvement for languages was 4.3% and the students regressed slightly in their reading (by 2.1%). In order statistically validate our results and account for inter-sample variance we performed a single-tailed t-test. This gave a p-value of 0.016 for the second test to indicate that it was highly likely the children’s improvement was due to their exposure to the games rather than variation of the children’s scores overall. The p-value for improvement in the mathematics test was 0.0018 indicating a greater probability that the children’s improvement was due to their exposure to the games. The p-value for the language test was marginal at 0.20 (0.089 for the boys) indicating that there is insufficient evidence to conclude that exposure to the games caused an improvement in the children’s results (using the standard p-value threshold of 0.05). Results also indicate that there is insufficient evidence to conclude that the drop in reading performance is due to exposure to the reading game (with a p-value of 0.38).

Despite the improvement in the children’s performance being more apparent in the final exam four days after the games session, the influence of Samuela appeared to be more apparent in the exam immediately after the test. Here the children seemed to perform about 2.7% better with Samuela. This was not however a statistically significant improvement and the trend actually appeared to be reversed in the exam applied four days after the test.

Conclusions

The work, so far, shows the potential of an embodied conversational agent (ECA) to improve the level of collaboration for students using interactive learning games. While our ECA was not found to have any significant impact on the realization of short term learning objectives, the quality of collaboration between children was seen to improve dramatically. Since collaboration is known to improve the achievement of learning objectives in the long term and the ability to work in a team is an important skill in itself, we strongly believe there would be significant benefits to the introduction of intelligent ECAs in collaborative learning environments. Our experiments also showed us that children tended to see an ECA in the role of a friendly teacher and were comfortable communicating with a synthetic character acting in this role. As future work we plan to annotate data from the experiments in order to visualize the dialogue along with indicators of collaboration to facilitate more rigorous analysis. This should help us uncover some of the mechanisms of collaboration between the children assisted by Samuela and contribute toward a more formal interaction strategy for the future implementation in a fully autonomous ECA.

Publications

P. Craig, et al., “A Cognitonics Approach to Computer Supported Learning in the Mexican State of Oaxaca,” Informatica: An International Journal of Computing and Informatics, vol. 38, pp. 263-271, 2015. Informatica Journal Article

Craig, Paul, Roa-Seïler, Néna, Martínez Díaz, Marcela, & Lara Rosano, Felipe. (2013). Assessing the potential of colaborative video games to improve education in la mixteca region of
mexico. Paper presented at the Third International Conference on Cognitonics, Slovenia. (Draft version)

Craig, Paul, Roa-Seïler, Néna, Rosano, Felipe Lara, & Díaz, Marcela Martínez. (2013). The role of embodied conversational agents in collaborative face to face computer supported learning games. Paper presented at the 26th International Conference on System Research, Informatics & Cybernetics, Baden Baden, Germany. Winner of the Outstanding Scholarly Contribution Award (Draft version)

Martínez García, D., Craig, P., Roa-Seiler, N. and Benítez Saucedo, A., “Validación de una estrategia de interacción de un agente corpóreo conversacional a través de la técnica del mago de Oz,” presented at the MexIHC, Mexico City, Mexico, 2012. ACM ISBN: 978-1-4503-1659-0
draft meihc_22

Combined Multidimensional Scaling and Hierarchical Clustering

Here we developed a novel information visualization technique that combines multidimensional scaling and hierarchical clustering to support the exploratory analysis of multidimensional data. The technique displays the results of multidimensional scaling using a scatter plot where the closeness of any two items’ representation’s are approximate to their similarity according to a Euclidean distance metric. The results of hierarchical clustering are overlaid onto this view by drawing smoothed outlines around each nested cluster. The difference in similarity between successive cluster combinations is used to colour code clusters and make stronger natural clusters more prominent in the display. When a cluster or group of items is selected, multidimensional scaling and hierarchical clustering are re-applied to a filtered subset of the data, and animation is used to smooth the transition between successive filtered views. As a case study we demonstrate the technique being used to analyse  survey data relating to the appropriateness of different phrases to different emotionally charged situations.

Our results were presented with poster poster at VDA2013.

P. Craig and N. Roa-Seïler, “A combined multidimensional scaling and hierarchical clustering view for the exploratory analysis of multidimensional data,” pp. 86540T-86540T, 2013.
2013_VDA

MexIHC

This year’s MexIHC conference allowed us to showcase some of the work carried out with our very talented students from the Universidad Tecnólogica de la Mixteca. Although I was not able to attend the conference myself, the feedback I received with regard to the students’ presentations was very encouraging. Daniel Martínez García presented a wizard of Oz (WoZ) framework for evaluating  the Embodied Conversational Agent (ECA) Samuela. Victor Manuel Garcia Luna presented a strategy for integrating cross-cultural differences in the design of a GUI implementing Information Society Indicators (ISIs). The university was also represented by two teams in the student design competition who finished 1st and 3rd.

Publications

Martínez García, D., Craig, P., Roa-Seiler, N. and Benítez Saucedo, A., “Validación de una estrategia de interacción de un agente corpóreo conversacional a través de la técnica del mago de Oz,” presented at the MexIHC, Mexico City, Mexico, 2012. ACM ISBN: 978-1-4503-1659-0
draft meihc_22

Victor Manuel Garcia Luna, Mario Alberto Moreno Rocha, Néna Roa Seïler, and Paul Craig., “Estrategia para la integración de diferencias transculturales en el diseño de una Interfaz Gráfica de Usuario (GUI) implementando Indicadores de Sociedad de Información (ISI)” presented at the MexIHC, Mexico City, Mexico, 2012. ACM ISBN: 978-1-4503-1659-0
mexihc2012_submission_24

Mexican History Browser

In our ECCE2012 paper “A Situated Cognition Aware Approach to the Design of Information Retrieval Systems for Geospatial Data” we describe a situated cognition aware approach to the design of information retrieval systems for geospatial data using the example of a system for events in Mexican history. This began with a requirements analysis exercise focused on identifying the actions that users want to realize with their data and context that is important for those actions. In the case of our search system for events in Mexican history, we discovered that users wanted to search for events and explore results within the context of town and city place-names. The next step was to develop a system that supported the process of situated cognition by allowing the user to realize these actions with the relevant context. In our case this application took the form of the Mexican history browser which ensures that place-names remain visible at all times (without being overlapped or removed) and allows the user to move around the map repositioning result labels when required using animation to smooth the transition between views. A user evaluation of the new design showed significant improvements in usability over existing techniques. Allowing users to explore the map helped them to discover unsuspected patterns of events and discover geographically related events. Maintaining the visibility of town/city place-names provided essential geographic context for results helping users to relate results to known places and existing knowledge.

This application is still being developed with more results to follow…

Publications

Craig, P., Roa-Seiler, N., Leplâtre, G., “A Situated Cognition Aware Approach to the Design of Information Retrieval Systems for Geospatial Data  ” in European Conference on Cognitive Ergonomics, Edinburgh, UK, 2012.
Craig_Seiler_Leplatre_ECCE2012 (final version)

Dialogue Explorer

The Dialogue Explorer is a novel vertical timeline information-visualization technique developed to support the analysis of human-computer dialogue data. The technique uses combined linked views including distorted views to effectively communicate the timing of dialogue events while presenting text in such a manner that it is easily readable. A prototype has been implemented and tested to demonstrate the technique’s effectiveness for supporting exploration and revealing previously unsuspected patterns.

Publications

Craig, P. and N. Roa-Seïler (2012). A Vertical Timeline Visualization for the Exploratory Analysis of Dialogue Data. Information Visualisation. Montpellier, France: 68 – 73. ISSN :  1550-6037 Print ISBN: 978-1-4673-2260-7
Craig_Roa_Vertical_Timeline IV2012

MaTSE: The Gene Expression Time-series Explorer

Existing techniques are found to be ill suited to finding patterns of changing activity over a limited interval of an experiments time frame. The Time-Series Explorer (TSE) was developed to overcome this limitation by allowing users to explore their data by controlling an animated scatter-plot view. MaTSE improves and extends TSE by allowing users to visualise data with missing values, cross reference multiple conditions, highlight gene groupings, and collaborate by sharing their findings.

gene groupings

Methods available for displaying gene groupings in the scatter-plot. a) color coding, b) outlined color, c) symbols, d) areas with texture and color, and e) smoothed outline shapes with transparent shading.

multiple conditions

Display of multiple conditions using a different set of linked scatter-plot and line-chart views for each condition.

coop'erative vis

Cooperative visualization in MaTSE: a) Cross-hair positioned at a rounded-value approximation of the mouse cursor position. The coordinates of the cursor are used to when forming queries. Bold font labels on the axes describe the cross-hair position to inform the user before and during query specification.  b) A users attempt to specify a threshold on the value of a single axis by dragging a box query. The user clicks on point I and drags to point II to form the box-query illustrated with dotted lines. c) The dotted line indicates the threshold the user wants to set and the threshold sent to the MaTSE pattern browser as the recorded query. This is also what the user sees when they elect to refine this query.

pattern

Animating the scatter-plot to view patterns of activity among gene groupings.

screenshot

A screenshot of the MaTSE interface. Labeled components are I) the pattern-browser, II) scatter-plot and III) line-chart. The current pattern is the result of two queries.

The video demo.

Publications

Craig, P., Cannon, A., Kukla, R., Kennedy, J. (2013). MaTSE: the gene expression time-series explorer. BMC Bioinformatics, 14(Suppl 19)(S1). (Draft version)

Craig, P., Cannon, A., Kukla, R., Kennedy, J. (2012, October). MaTSE: The Microarray Time-Series Explorer. Paper presented at 2nd IEEE Symposium on Biological Data Visualization, Seattle, WA.

Craig, P., Kennedy, J., Kukla, R., Cannon, A. (2010). Pattern Browsing and Query Adjustment for the Exploratory Analysis and Cooperative Visualisation of Microarray Time-course Data. In: Luo, Y. (Ed.) Proceedings of the 7th International Conference on Cooperative Design, Visualisation and Engineering, 6240/2010. (pp. 199-206). Mallorca, Spain: Lecture Notes in Computer Science.

fp – PCraigGB-1

Refactoring Data Transforms in MaTSE for Flexibility

This paper describes the refactoring of the Time-series Explorer (TSE) data transforms for them to be re-used in MaTSE. In early prototypes of the TSE data transforms were tightly coupled with visualisation components. While this allowed us to achieve our initial objective of developing the application to the level where we were able to demonstrate the basic visualisation technique with a specific dataset, refactoring to a more flexible code structure was required in order to apply a larger number of transforms and accommodate a wider variety of data-sets. This paper reports on our planning and execution of this refactoring exercise.

Craig, P., Kennedy, J. (2009). Refactoring Data Transforms in MaTSE for Flexibility. Paper presented at REVISE: Refactoring Visualization from Experience, VizWeek Workshop, Atlantic City, NJ.
Craig_Kennedy_Revise_09


Time-series Explorer

The Time-series Explorer is a novel information visualisation technique using animated views to support the exploratory analysis of microarray time-course data. The main benefit of animation was that it allowed the display to be capable of conveying large amounts of information by utilising a third display dimension (i.e. time). The display also mapped time in the data to time in the display in a manner that ensured that motion could be related to meaningful qualities of the data. This allowed the users to detect and interpret a quantity of valuable patterns in their data and, specifically, find patterns of common activity over intervals of the data that could not be found using established techniques. Once a pattern was detected, the user could interact with a static frame of the animation and relate that view with complementary linked views, to read the pattern, in order to extract valuable knowledge.

A basic version of the technique was first shown at Information Visualisation 2002 in London. This demonstrated a novel display technique, which operates over a continuous temporal subset of the time series, with direct manipulation of the parameters defining the subset.

screenshot

Later, we extended the technique to include a linked line-graph and sliders to define query parameters. This version of the tool was demonstrated at InfVis2003 in Seattle.

TSEprototype2

The final version of the tool allowed the user to specify queries by interacting directly with the scatter-plot. It also included features such as colour-density mapping for occluded genes and excentric labelling. We were also able to evaluate this version of the tool to find a number of expected and unexpected patterns in microarray gene expression data. These features and results were presented at CMV2005 (part of IV2005) and publishes in the Journal of Information Visualisation (2006).

screenshot
The final TSE interface
animationFrames from the animated scatter-plot

patternAn unexpected pattern found using the TSE

The results also formed an important part of my thesis (2006) and the development of TSE allowed us to prescribe a set of draft guidelines for developing animated visualisations to support the exploratory analysis of large-scale data. These are as follows:

  1. Animated views should be configured so that the motion has relevant meaning.
  2. The pace and direction of the animation should be controlled by the user.
  3. The motion of objects should be smoothed and regulated to avoid the undesirable effects of erratic or unpredictable motion (e.g. interpolation across time and distortion of the display space).
  4. Static views (coordinated and linked) should be available to help the user read a pattern once it is detected.
  5. Static views (coordinated and linked) can be used to help the user interpret the animation.
  6. The animated view can be used as a static view (see 4 and 5) when the animation is paused.

A general conclusion to be drawn from the work is that animation, where time in the data is mapped to time in the data, has enormous potential to be used to great effect in an information visualisation. While the effects of animation on human perception is less well understood than the effects of a static display, this should not discourage a developer from considering an animated visualisation if the benefits of expressiveness and an extra display dimension are required. Many of the problems with the perception of animation encountered during this project were easy to detect during user evaluations and relatively easy to eliminate after they were detected. In this case, at least, the benefits of animation were found to outstrip its disadvantages with the technique developed using animation allowing biologists to find significant patterns they could not previously find using any other techniques. It is hoped that this thesis will guide other developers toward considering the use of animation in their own information visualisation applications to achieve similar results.

Publications

Craig, P. (2006). Animated Interval Scatter-plot Views for the Exploratory Analysis of Large Scale Microarray Time-course Data (PhD). Edinburgh Napier University.
Paul Craig – thesis

Craig, P., Kennedy, J., Cumming, A. (2005). Animated Interval Scatter-plot Views for the Exploratory Analysis of Large Scale Microarray Time-course Data. Information Visualization, 4(3), 149-163.
Full colour3

Craig, P., Kennedy, J., Cumming, A. (2005). Coordinated Parallel Views for the Exploratory Analysis of Microarray Time-course Data. In: Proceedings of 3rd International Conference on Coordinated & Multiple Views in Exploratory Visualization. (pp. 3-14). London: IEEE Computer Society Press.
cmv_05

Craig, P., Kennedy, J., Cumming, A. (2005). Time-series Explorer: An Animated Information Visualisation for Microarray Time-course Data. BMC Bioinformatics 2005, 6(3), P8.
FRE Poster (A0)

Craig, P., Kennedy, J. (2003). Coordinated Graph and Scatter-Plot Views for the Visual Exploration of Microarray Time-Series Data. In: IEEE Symposium on Information Visualization. (pp. 173-180). Seattle WA: IEEE Computer Society Press.
craig

Craig, P., Kennedy, J., Cumming, A. (2002). Towards Visualising Temporal Features in Large Scale Microarray Time-series Data. In: 6th International Conference on Information Visualisation – IV2002. (pp. 427-433). IEEE Computer Society Press.
craig_microarray_02

TaxVis at Edinburgh Napier

This paper by Martin Graham, Jessie Kennedy and myself (mostly Martin and Jessie) describes some of the taxonomic visualisation work undertaken at Edinburgh Napier University. This includes the Concept Relationship Editor and the impressive TaxVis application designed and developed by Martin Graham. Jessie and Martin’s current project VIPER also looks very interesting, its a tool to remove errors in animal pedigree information caused by administrative and data handling faults.

Publication

Graham, M., Craig, P., Kennedy, J. (2008). Visualisation to Aid Biodiversity Studies through Accurate Taxonomic Reconciliation. In: Gray, A., Jeffery, K., Shao, J. (Eds.) Proceedings of British National Conference on Database Systems: Sharing Data, Information and Knowledge, 5071/2008 (LNCS 5071 ed.). (pp. 280-291). Cardiff, UK: Springer-Verlag.
GrahamCKBioVis

Concept Relationship Editor

The Concept Relationship Editor is an interactive visualisation tool designed to support the specification of relationships between hierarchical taxonomic classifications. The tool operates using an interactive space-filling adjacency layout which allows users to expand multiple lists of taxa with common parents so they can explore and add relationships between two classifications. Whenever selected lists contain too many items for them to be legible within the restrictions of available screen space the user can alleviate the problem by either operating in ‘lens mode’ or ‘scroll mode’. In ‘lens mode’ the layout is configured so that both of the classifications and all the relationships are completely visible on-screen. Here a fish-eye lens type distortion effect is applied under the cursor to allow taxa names with less assigned space to be made legible. In ‘scroll mode’ the layout assigns sufficient space for the labels of all expanded taxa lists to be legible and scroll bars can be used to navigate across the hierarchy of either classification. While the ‘lens mode’ provides context and allows for more direct comparison of relationships throughout the classifications, ‘scroll mode’ tends to allow for relationships to be added more efficiently between smaller groups of similarly classified taxa.

Navigation

Fisheye views

Creating a relationship

Publications

Craig, P., Kennedy, J. (2008). Concept Relationship Editor: A visual interface to support the assertion of synonymy relationships between taxonomic classifications. In: Börner, K., Gröhn, M., Park, J., Roberts, J. (Eds.) Visualization and Data Analysis 2008, Proceedings of the SPIE, 6809. (pp. 680906-680912). San Jose, CA: Society of Photo-Optical Instrumentation Engineers, Bellingham, WA, ETATS-UNIS .
Craig Kenedy_Concept Relationship Editor

Graham, M., Craig, P., Kennedy, J. (2008). Visualisation to Aid Biodiversity Studies through Accurate Taxonomic Reconciliation. In: Gray, A., Jeffery, K., Shao, J. (Eds.) Proceedings of British National Conference on Database Systems: Sharing Data, Information and Knowledge, 5071/2008 (LNCS 5071 ed.). (pp. 280-291). Cardiff, UK: Springer-Verlag.
GrahamCKBioVis

Craig, P., Kennedy, J. (2007). Concept Relationship Editor: A visual interface to support the creation of relationships between taxonomic classifications (poster). Paper presented at InfoVis2007, Sacramento CA.
Craig_Kennedy Poster Summary