Combined Multidimensional Scaling and Hierarchical Clustering

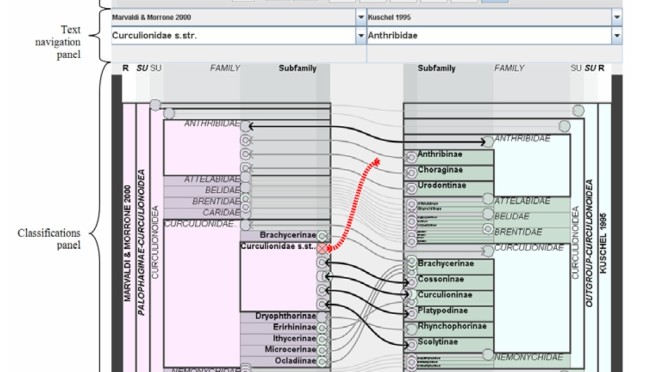
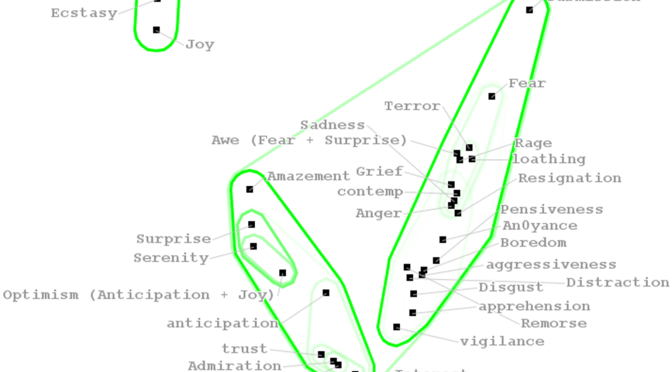
Here we developed a novel information visualization technique that combines multidimensional scaling and hierarchical clustering to support the exploratory analysis of multidimensional data. The technique displays the results of multidimensional scaling using a scatter plot where the closeness of any two items’ representation’s are approximate to their similarity according to a Euclidean distance metric. The results of hierarchical clustering are overlaid onto this view by drawing smoothed outlines around each nested cluster. The difference in similarity between successive cluster combinations is used to colour code clusters and make stronger natural clusters more prominent in the display. When a cluster or group of items is selected, multidimensional scaling and hierarchical clustering are re-applied to a filtered subset of the data, and animation is used to smooth the transition between successive filtered views. As a case study we demonstrate the technique being used to analyse  survey data relating to the appropriateness of different phrases to different emotionally charged situations.

Our results were presented with poster poster at VDA2013.

P. Craig and N. Roa-Seïler, “A combined multidimensional scaling and hierarchical clustering view for the exploratory analysis of multidimensional data,” pp. 86540T-86540T, 2013.
2013_VDA

Concept Relationship Editor

The Concept Relationship Editor is an interactive visualisation tool designed to support the specification of relationships between hierarchical taxonomic classifications. The tool operates using an interactive space-filling adjacency layout which allows users to expand multiple lists of taxa with common parents so they can explore and add relationships between two classifications. Whenever selected lists contain too many items for them to be legible within the restrictions of available screen space the user can alleviate the problem by either operating in ‘lens mode’ or ‘scroll mode’. In ‘lens mode’ the layout is configured so that both of the classifications and all the relationships are completely visible on-screen. Here a fish-eye lens type distortion effect is applied under the cursor to allow taxa names with less assigned space to be made legible. In ‘scroll mode’ the layout assigns sufficient space for the labels of all expanded taxa lists to be legible and scroll bars can be used to navigate across the hierarchy of either classification. While the ‘lens mode’ provides context and allows for more direct comparison of relationships throughout the classifications, ‘scroll mode’ tends to allow for relationships to be added more efficiently between smaller groups of similarly classified taxa.

Navigation

Fisheye views

Creating a relationship

Publications

Craig, P., Kennedy, J. (2008). Concept Relationship Editor: A visual interface to support the assertion of synonymy relationships between taxonomic classifications. In: Börner, K., Gröhn, M., Park, J., Roberts, J. (Eds.) Visualization and Data Analysis 2008, Proceedings of the SPIE, 6809. (pp. 680906-680912). San Jose, CA: Society of Photo-Optical Instrumentation Engineers, Bellingham, WA, ETATS-UNIS .
Craig Kenedy_Concept Relationship Editor

Graham, M., Craig, P., Kennedy, J. (2008). Visualisation to Aid Biodiversity Studies through Accurate Taxonomic Reconciliation. In: Gray, A., Jeffery, K., Shao, J. (Eds.) Proceedings of British National Conference on Database Systems: Sharing Data, Information and Knowledge, 5071/2008 (LNCS 5071 ed.). (pp. 280-291). Cardiff, UK: Springer-Verlag.
GrahamCKBioVis

Craig, P., Kennedy, J. (2007). Concept Relationship Editor: A visual interface to support the creation of relationships between taxonomic classifications (poster). Paper presented at InfoVis2007, Sacramento CA.
Craig_Kennedy Poster Summary