Combined Multidimensional Scaling and Hierarchical Clustering

Here we developed a novel information visualization technique that combines multidimensional scaling and hierarchical clustering to support the exploratory analysis of multidimensional data. The technique displays the results of multidimensional scaling using a scatter plot where the closeness of any two items’ representation’s are approximate to their similarity according to a Euclidean distance metric. The results of hierarchical clustering are overlaid onto this view by drawing smoothed outlines around each nested cluster. The difference in similarity between successive cluster combinations is used to colour code clusters and make stronger natural clusters more prominent in the display. When a cluster or group of items is selected, multidimensional scaling and hierarchical clustering are re-applied to a filtered subset of the data, and animation is used to smooth the transition between successive filtered views. As a case study we demonstrate the technique being used to analyse  survey data relating to the appropriateness of different phrases to different emotionally charged situations.

Our results were presented with poster poster at VDA2013.

P. Craig and N. Roa-Seïler, “A combined multidimensional scaling and hierarchical clustering view for the exploratory analysis of multidimensional data,” pp. 86540T-86540T, 2013.
2013_VDA

Mexican History Browser

In our ECCE2012 paper “A Situated Cognition Aware Approach to the Design of Information Retrieval Systems for Geospatial Data” we describe a situated cognition aware approach to the design of information retrieval systems for geospatial data using the example of a system for events in Mexican history. This began with a requirements analysis exercise focused on identifying the actions that users want to realize with their data and context that is important for those actions. In the case of our search system for events in Mexican history, we discovered that users wanted to search for events and explore results within the context of town and city place-names. The next step was to develop a system that supported the process of situated cognition by allowing the user to realize these actions with the relevant context. In our case this application took the form of the Mexican history browser which ensures that place-names remain visible at all times (without being overlapped or removed) and allows the user to move around the map repositioning result labels when required using animation to smooth the transition between views. A user evaluation of the new design showed significant improvements in usability over existing techniques. Allowing users to explore the map helped them to discover unsuspected patterns of events and discover geographically related events. Maintaining the visibility of town/city place-names provided essential geographic context for results helping users to relate results to known places and existing knowledge.

This application is still being developed with more results to follow…

Publications

Craig, P., Roa-Seiler, N., Leplâtre, G., “A Situated Cognition Aware Approach to the Design of Information Retrieval Systems for Geospatial Data  ” in European Conference on Cognitive Ergonomics, Edinburgh, UK, 2012.
Craig_Seiler_Leplatre_ECCE2012 (final version)

Dialogue Explorer

The Dialogue Explorer is a novel vertical timeline information-visualization technique developed to support the analysis of human-computer dialogue data. The technique uses combined linked views including distorted views to effectively communicate the timing of dialogue events while presenting text in such a manner that it is easily readable. A prototype has been implemented and tested to demonstrate the technique’s effectiveness for supporting exploration and revealing previously unsuspected patterns.

Publications

Craig, P. and N. Roa-Seïler (2012). A Vertical Timeline Visualization for the Exploratory Analysis of Dialogue Data. Information Visualisation. Montpellier, France: 68 – 73. ISSN :  1550-6037 Print ISBN: 978-1-4673-2260-7
Craig_Roa_Vertical_Timeline IV2012

MaTSE: The Gene Expression Time-series Explorer

Existing techniques are found to be ill suited to finding patterns of changing activity over a limited interval of an experiments time frame. The Time-Series Explorer (TSE) was developed to overcome this limitation by allowing users to explore their data by controlling an animated scatter-plot view. MaTSE improves and extends TSE by allowing users to visualise data with missing values, cross reference multiple conditions, highlight gene groupings, and collaborate by sharing their findings.

gene groupings

Methods available for displaying gene groupings in the scatter-plot. a) color coding, b) outlined color, c) symbols, d) areas with texture and color, and e) smoothed outline shapes with transparent shading.

multiple conditions

Display of multiple conditions using a different set of linked scatter-plot and line-chart views for each condition.

coop'erative vis

Cooperative visualization in MaTSE: a) Cross-hair positioned at a rounded-value approximation of the mouse cursor position. The coordinates of the cursor are used to when forming queries. Bold font labels on the axes describe the cross-hair position to inform the user before and during query specification.  b) A users attempt to specify a threshold on the value of a single axis by dragging a box query. The user clicks on point I and drags to point II to form the box-query illustrated with dotted lines. c) The dotted line indicates the threshold the user wants to set and the threshold sent to the MaTSE pattern browser as the recorded query. This is also what the user sees when they elect to refine this query.

pattern

Animating the scatter-plot to view patterns of activity among gene groupings.

screenshot

A screenshot of the MaTSE interface. Labeled components are I) the pattern-browser, II) scatter-plot and III) line-chart. The current pattern is the result of two queries.

The video demo.

Publications

Craig, P., Cannon, A., Kukla, R., Kennedy, J. (2013). MaTSE: the gene expression time-series explorer. BMC Bioinformatics, 14(Suppl 19)(S1). (Draft version)

Craig, P., Cannon, A., Kukla, R., Kennedy, J. (2012, October). MaTSE: The Microarray Time-Series Explorer. Paper presented at 2nd IEEE Symposium on Biological Data Visualization, Seattle, WA.

Craig, P., Kennedy, J., Kukla, R., Cannon, A. (2010). Pattern Browsing and Query Adjustment for the Exploratory Analysis and Cooperative Visualisation of Microarray Time-course Data. In: Luo, Y. (Ed.) Proceedings of the 7th International Conference on Cooperative Design, Visualisation and Engineering, 6240/2010. (pp. 199-206). Mallorca, Spain: Lecture Notes in Computer Science.

fp – PCraigGB-1

Refactoring Data Transforms in MaTSE for Flexibility

This paper describes the refactoring of the Time-series Explorer (TSE) data transforms for them to be re-used in MaTSE. In early prototypes of the TSE data transforms were tightly coupled with visualisation components. While this allowed us to achieve our initial objective of developing the application to the level where we were able to demonstrate the basic visualisation technique with a specific dataset, refactoring to a more flexible code structure was required in order to apply a larger number of transforms and accommodate a wider variety of data-sets. This paper reports on our planning and execution of this refactoring exercise.

Craig, P., Kennedy, J. (2009). Refactoring Data Transforms in MaTSE for Flexibility. Paper presented at REVISE: Refactoring Visualization from Experience, VizWeek Workshop, Atlantic City, NJ.
Craig_Kennedy_Revise_09


Time-series Explorer

The Time-series Explorer is a novel information visualisation technique using animated views to support the exploratory analysis of microarray time-course data. The main benefit of animation was that it allowed the display to be capable of conveying large amounts of information by utilising a third display dimension (i.e. time). The display also mapped time in the data to time in the display in a manner that ensured that motion could be related to meaningful qualities of the data. This allowed the users to detect and interpret a quantity of valuable patterns in their data and, specifically, find patterns of common activity over intervals of the data that could not be found using established techniques. Once a pattern was detected, the user could interact with a static frame of the animation and relate that view with complementary linked views, to read the pattern, in order to extract valuable knowledge.

A basic version of the technique was first shown at Information Visualisation 2002 in London. This demonstrated a novel display technique, which operates over a continuous temporal subset of the time series, with direct manipulation of the parameters defining the subset.

screenshot

Later, we extended the technique to include a linked line-graph and sliders to define query parameters. This version of the tool was demonstrated at InfVis2003 in Seattle.

TSEprototype2

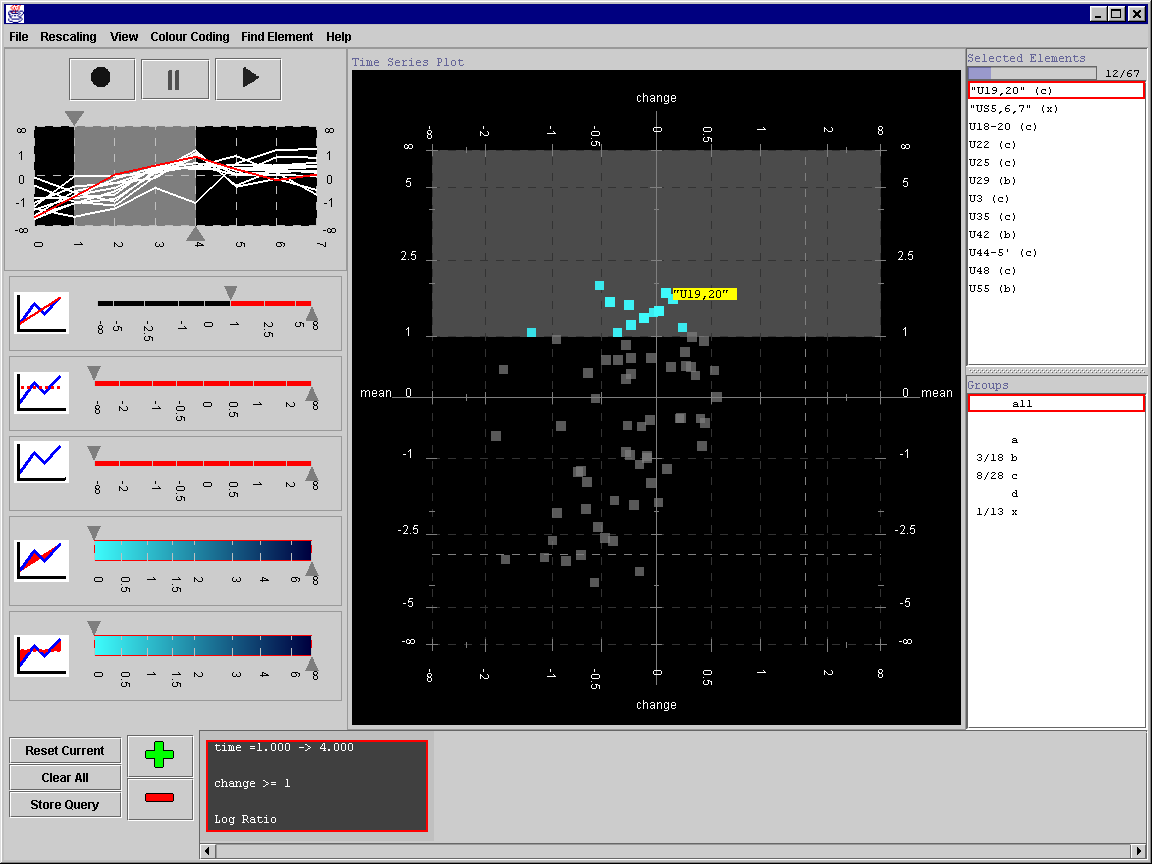
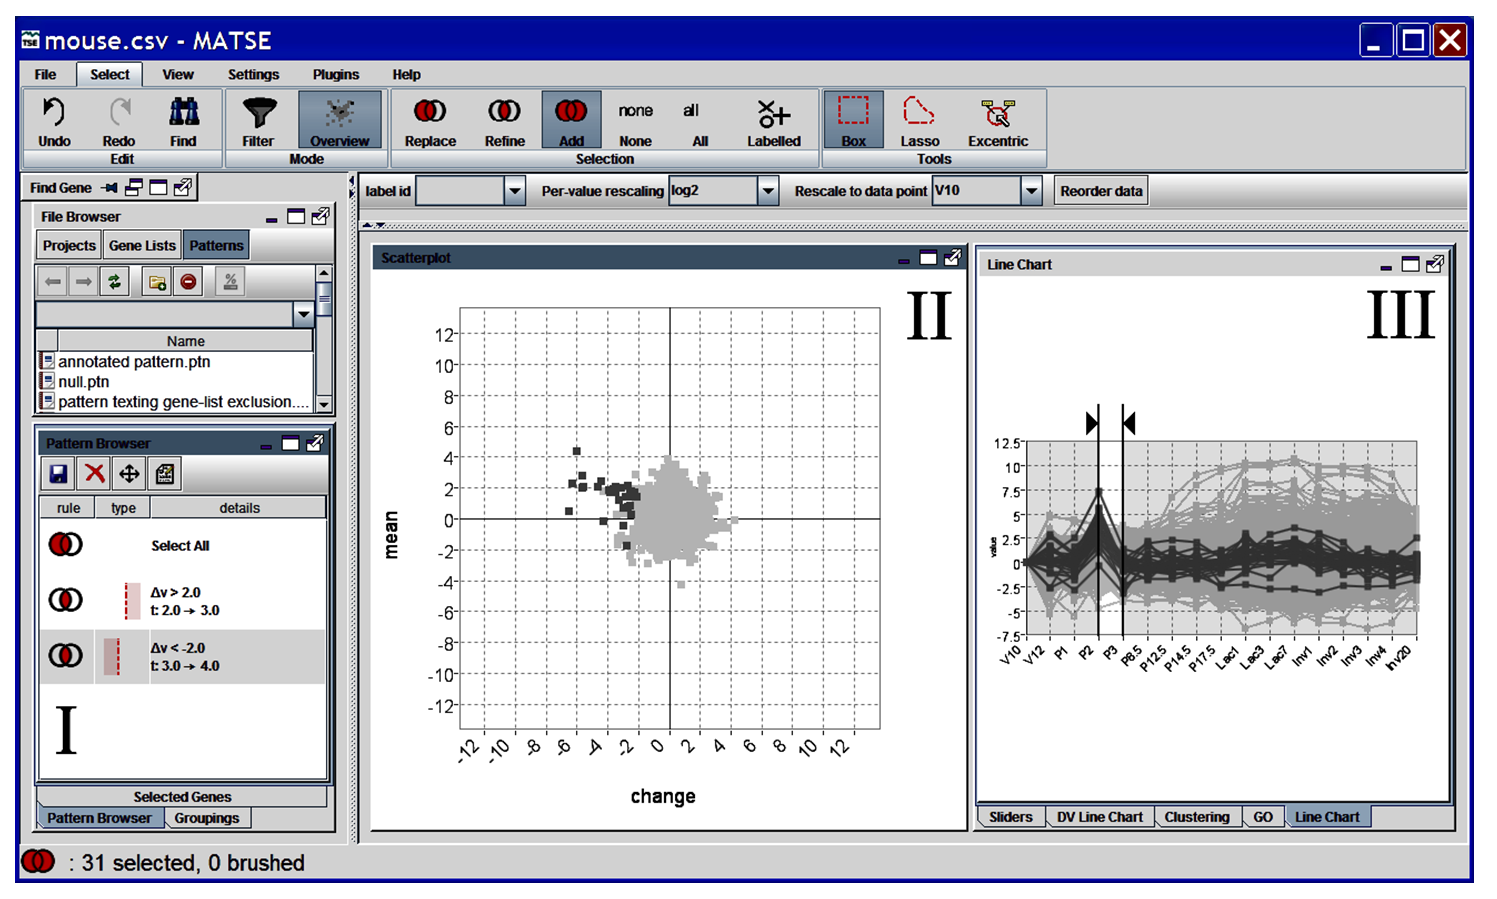
The final version of the tool allowed the user to specify queries by interacting directly with the scatter-plot. It also included features such as colour-density mapping for occluded genes and excentric labelling. We were also able to evaluate this version of the tool to find a number of expected and unexpected patterns in microarray gene expression data. These features and results were presented at CMV2005 (part of IV2005) and publishes in the Journal of Information Visualisation (2006).

screenshot
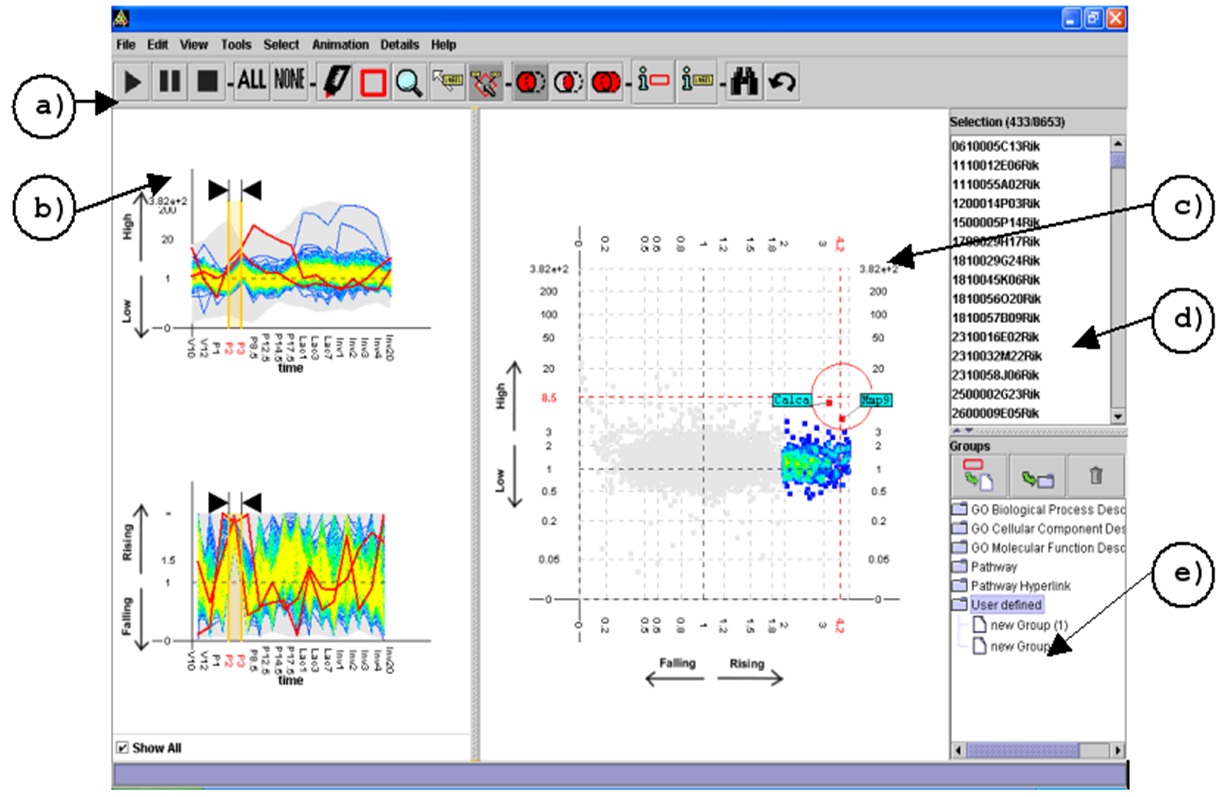
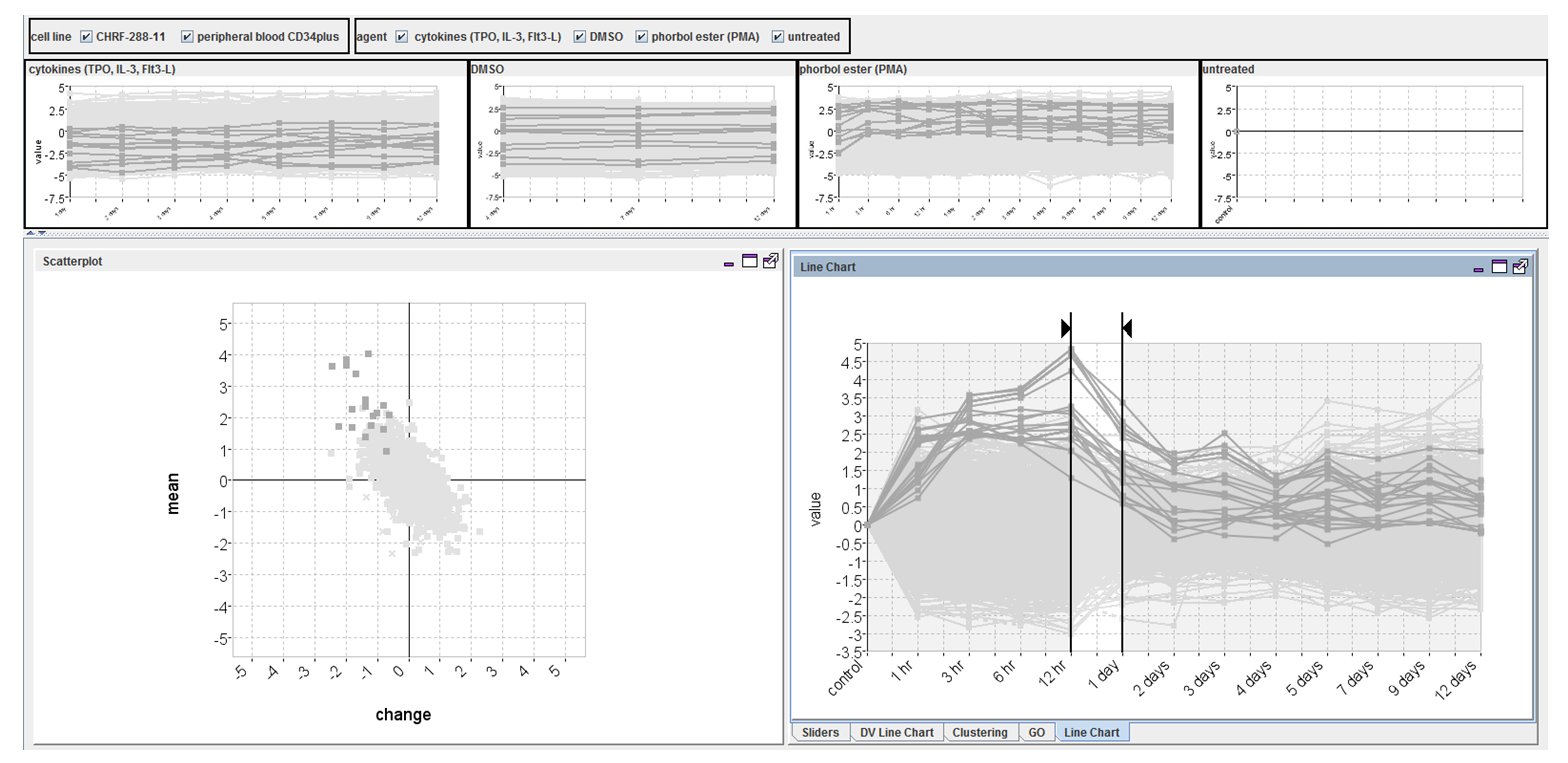
The final TSE interface
animation
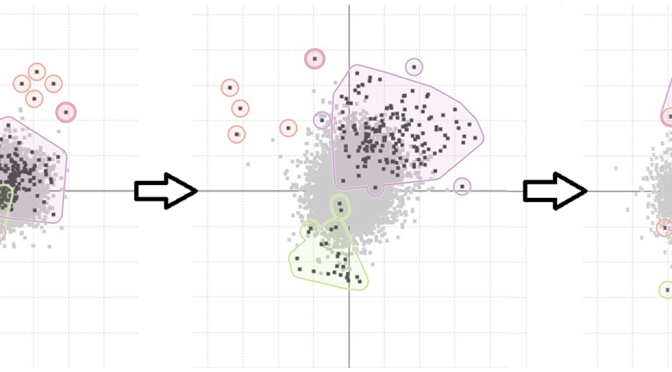
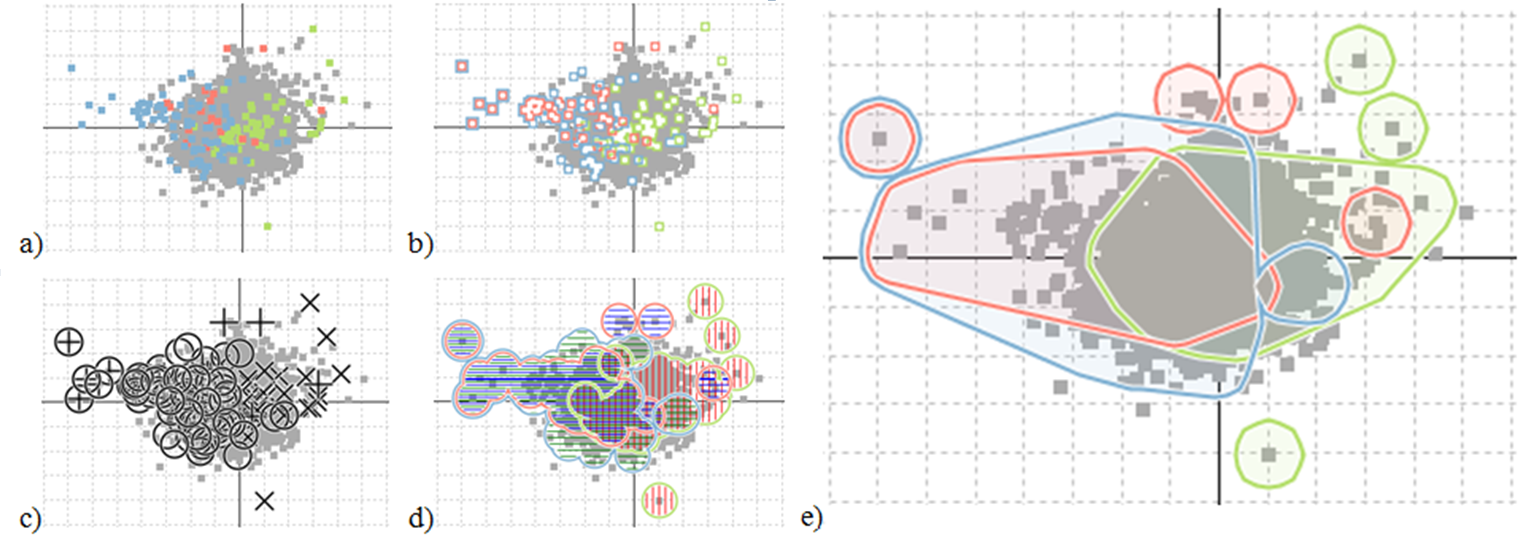
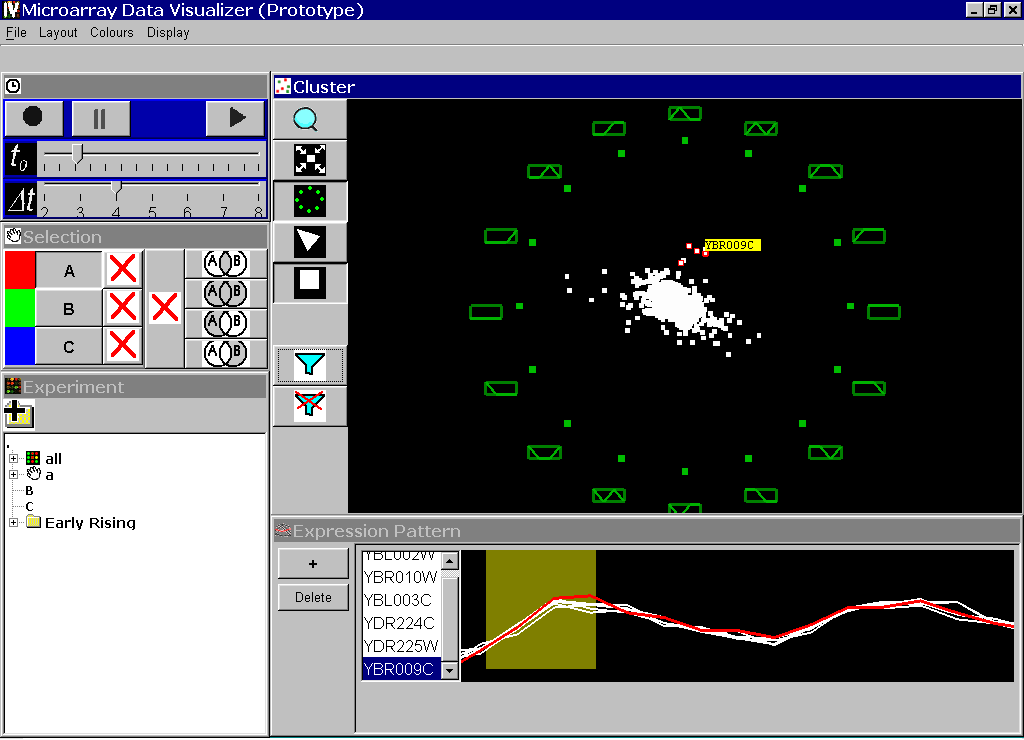
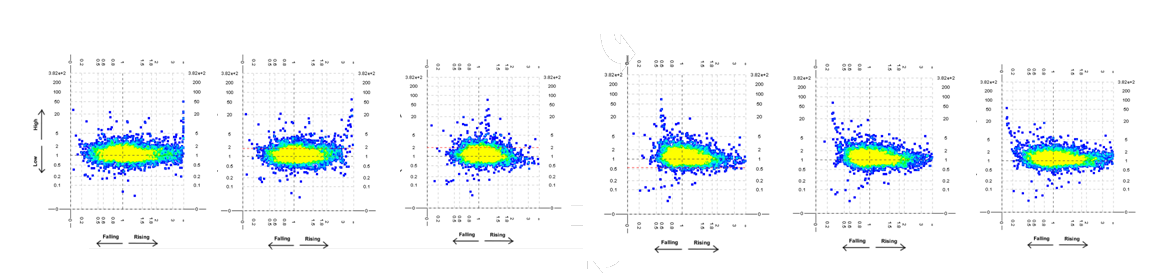
Frames from the animated scatter-plot

pattern
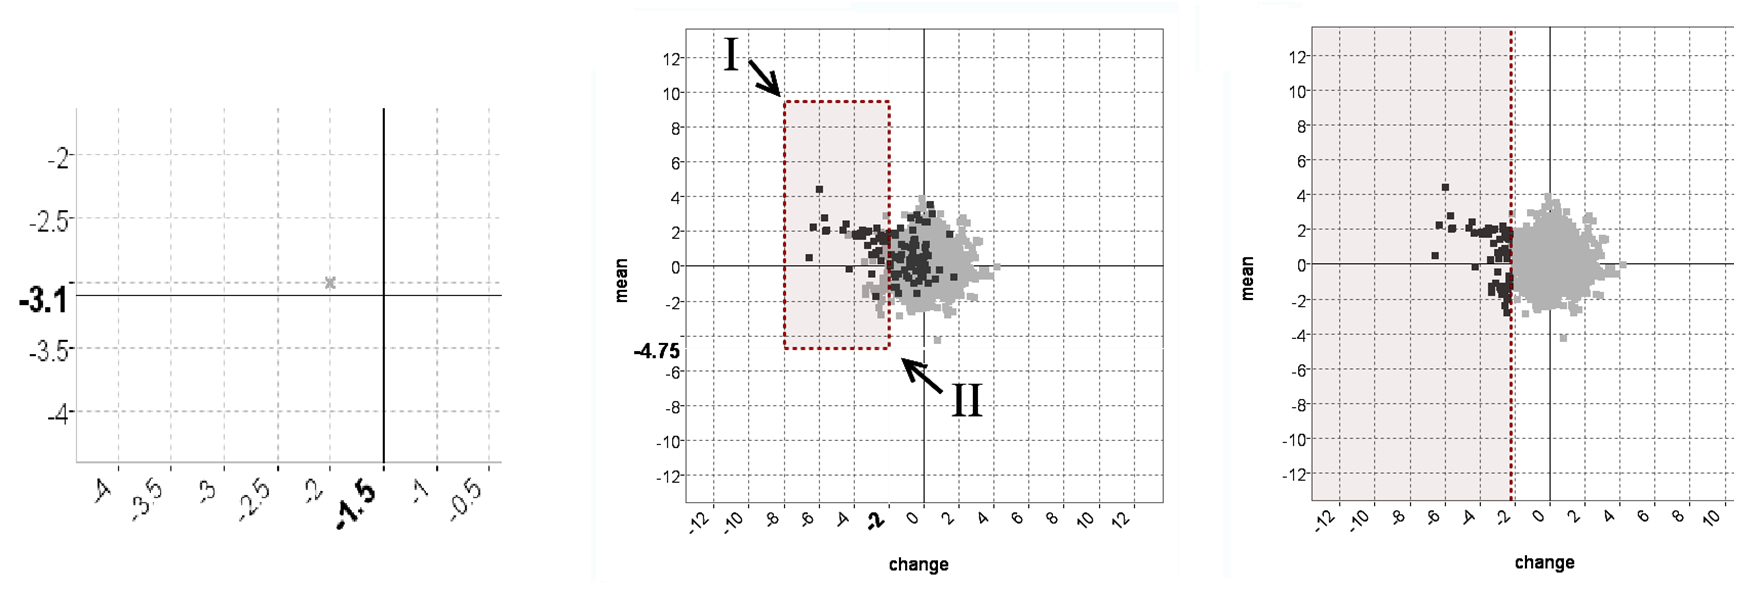
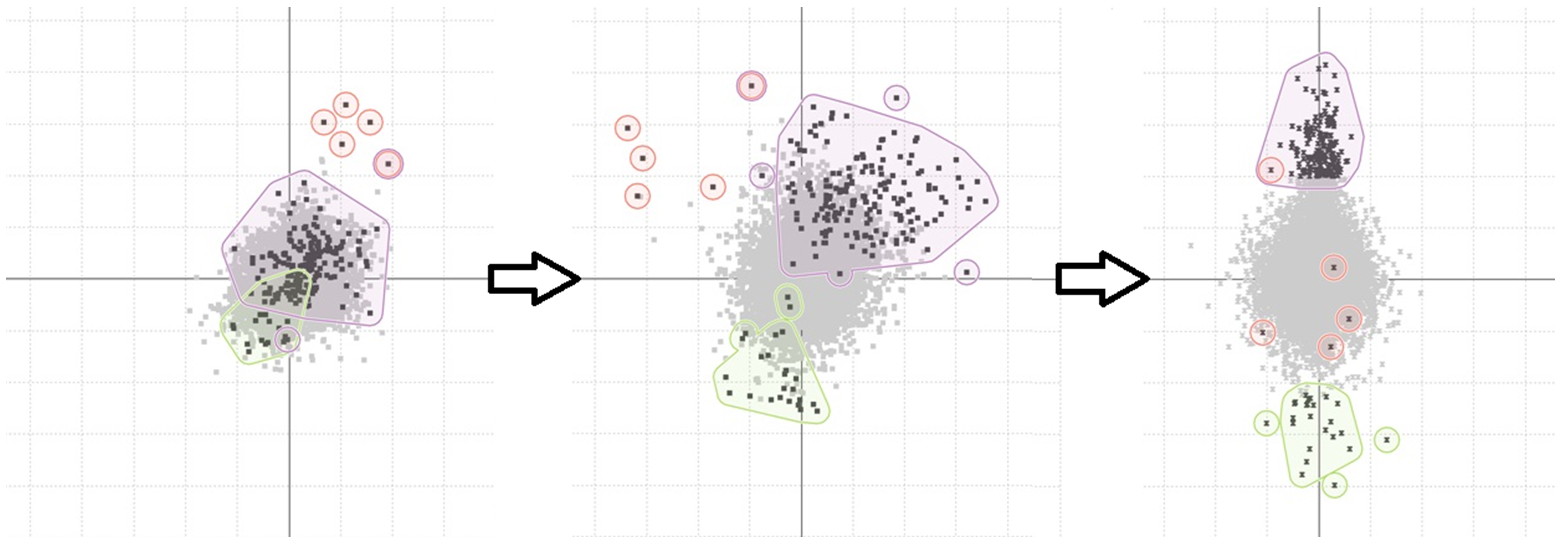
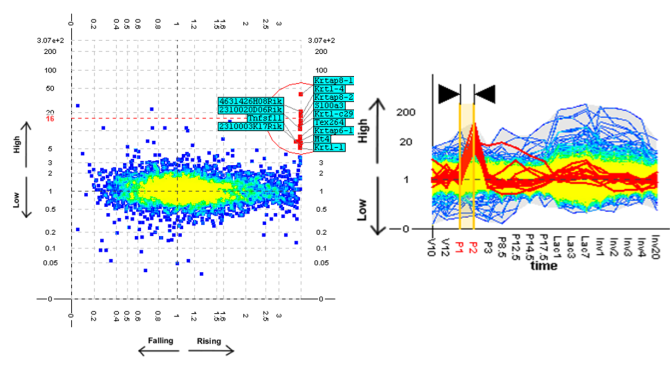
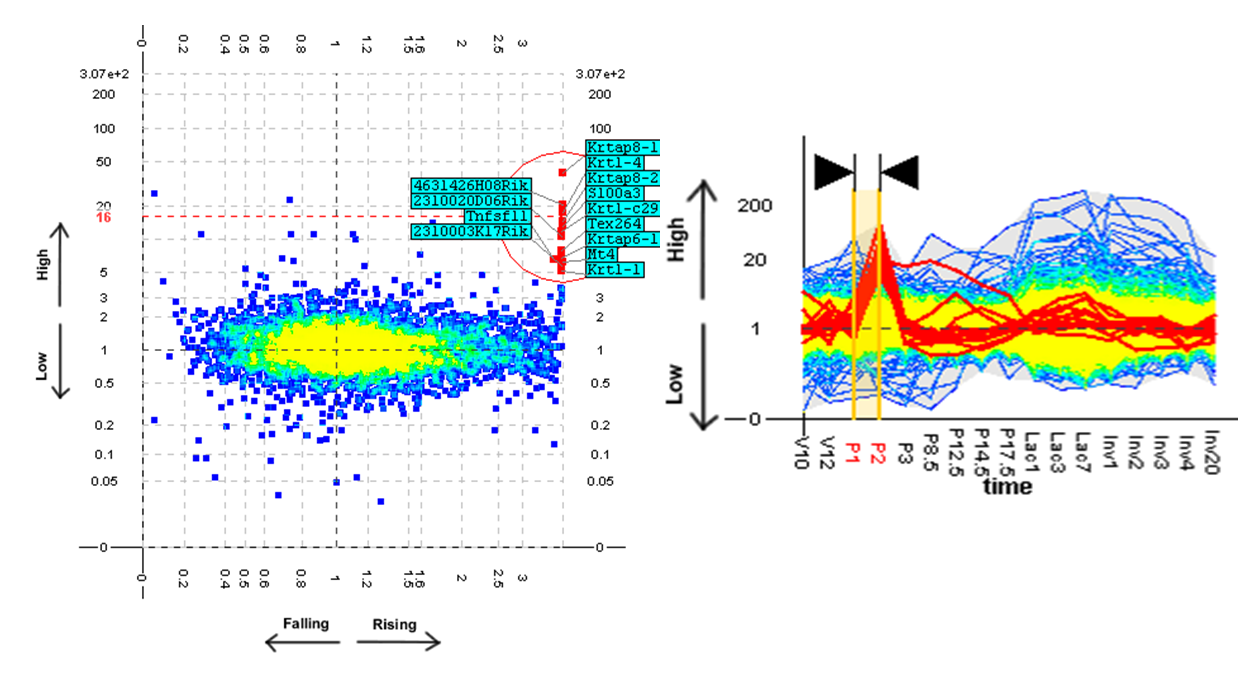
An unexpected pattern found using the TSE

The results also formed an important part of my thesis (2006) and the development of TSE allowed us to prescribe a set of draft guidelines for developing animated visualisations to support the exploratory analysis of large-scale data. These are as follows:

  1. Animated views should be configured so that the motion has relevant meaning.
  2. The pace and direction of the animation should be controlled by the user.
  3. The motion of objects should be smoothed and regulated to avoid the undesirable effects of erratic or unpredictable motion (e.g. interpolation across time and distortion of the display space).
  4. Static views (coordinated and linked) should be available to help the user read a pattern once it is detected.
  5. Static views (coordinated and linked) can be used to help the user interpret the animation.
  6. The animated view can be used as a static view (see 4 and 5) when the animation is paused.

A general conclusion to be drawn from the work is that animation, where time in the data is mapped to time in the data, has enormous potential to be used to great effect in an information visualisation. While the effects of animation on human perception is less well understood than the effects of a static display, this should not discourage a developer from considering an animated visualisation if the benefits of expressiveness and an extra display dimension are required. Many of the problems with the perception of animation encountered during this project were easy to detect during user evaluations and relatively easy to eliminate after they were detected. In this case, at least, the benefits of animation were found to outstrip its disadvantages with the technique developed using animation allowing biologists to find significant patterns they could not previously find using any other techniques. It is hoped that this thesis will guide other developers toward considering the use of animation in their own information visualisation applications to achieve similar results.

Publications

Craig, P. (2006). Animated Interval Scatter-plot Views for the Exploratory Analysis of Large Scale Microarray Time-course Data (PhD). Edinburgh Napier University.
Paul Craig – thesis

Craig, P., Kennedy, J., Cumming, A. (2005). Animated Interval Scatter-plot Views for the Exploratory Analysis of Large Scale Microarray Time-course Data. Information Visualization, 4(3), 149-163.
Full colour3

Craig, P., Kennedy, J., Cumming, A. (2005). Coordinated Parallel Views for the Exploratory Analysis of Microarray Time-course Data. In: Proceedings of 3rd International Conference on Coordinated & Multiple Views in Exploratory Visualization. (pp. 3-14). London: IEEE Computer Society Press.
cmv_05

Craig, P., Kennedy, J., Cumming, A. (2005). Time-series Explorer: An Animated Information Visualisation for Microarray Time-course Data. BMC Bioinformatics 2005, 6(3), P8.
FRE Poster (A0)

Craig, P., Kennedy, J. (2003). Coordinated Graph and Scatter-Plot Views for the Visual Exploration of Microarray Time-Series Data. In: IEEE Symposium on Information Visualization. (pp. 173-180). Seattle WA: IEEE Computer Society Press.
craig

Craig, P., Kennedy, J., Cumming, A. (2002). Towards Visualising Temporal Features in Large Scale Microarray Time-series Data. In: 6th International Conference on Information Visualisation – IV2002. (pp. 427-433). IEEE Computer Society Press.
craig_microarray_02

TaxVis at Edinburgh Napier

This paper by Martin Graham, Jessie Kennedy and myself (mostly Martin and Jessie) describes some of the taxonomic visualisation work undertaken at Edinburgh Napier University. This includes the Concept Relationship Editor and the impressive TaxVis application designed and developed by Martin Graham. Jessie and Martin’s current project VIPER also looks very interesting, its a tool to remove errors in animal pedigree information caused by administrative and data handling faults.

Publication

Graham, M., Craig, P., Kennedy, J. (2008). Visualisation to Aid Biodiversity Studies through Accurate Taxonomic Reconciliation. In: Gray, A., Jeffery, K., Shao, J. (Eds.) Proceedings of British National Conference on Database Systems: Sharing Data, Information and Knowledge, 5071/2008 (LNCS 5071 ed.). (pp. 280-291). Cardiff, UK: Springer-Verlag.
GrahamCKBioVis

Concept Relationship Editor

The Concept Relationship Editor is an interactive visualisation tool designed to support the specification of relationships between hierarchical taxonomic classifications. The tool operates using an interactive space-filling adjacency layout which allows users to expand multiple lists of taxa with common parents so they can explore and add relationships between two classifications. Whenever selected lists contain too many items for them to be legible within the restrictions of available screen space the user can alleviate the problem by either operating in ‘lens mode’ or ‘scroll mode’. In ‘lens mode’ the layout is configured so that both of the classifications and all the relationships are completely visible on-screen. Here a fish-eye lens type distortion effect is applied under the cursor to allow taxa names with less assigned space to be made legible. In ‘scroll mode’ the layout assigns sufficient space for the labels of all expanded taxa lists to be legible and scroll bars can be used to navigate across the hierarchy of either classification. While the ‘lens mode’ provides context and allows for more direct comparison of relationships throughout the classifications, ‘scroll mode’ tends to allow for relationships to be added more efficiently between smaller groups of similarly classified taxa.

Navigation

Fisheye views

Creating a relationship

Publications

Craig, P., Kennedy, J. (2008). Concept Relationship Editor: A visual interface to support the assertion of synonymy relationships between taxonomic classifications. In: Börner, K., Gröhn, M., Park, J., Roberts, J. (Eds.) Visualization and Data Analysis 2008, Proceedings of the SPIE, 6809. (pp. 680906-680912). San Jose, CA: Society of Photo-Optical Instrumentation Engineers, Bellingham, WA, ETATS-UNIS .
Craig Kenedy_Concept Relationship Editor

Graham, M., Craig, P., Kennedy, J. (2008). Visualisation to Aid Biodiversity Studies through Accurate Taxonomic Reconciliation. In: Gray, A., Jeffery, K., Shao, J. (Eds.) Proceedings of British National Conference on Database Systems: Sharing Data, Information and Knowledge, 5071/2008 (LNCS 5071 ed.). (pp. 280-291). Cardiff, UK: Springer-Verlag.
GrahamCKBioVis

Craig, P., Kennedy, J. (2007). Concept Relationship Editor: A visual interface to support the creation of relationships between taxonomic classifications (poster). Paper presented at InfoVis2007, Sacramento CA.
Craig_Kennedy Poster Summary